
In the pharmacy market, manual pharmacy data reporting can often feel like the elephant in the room - a bottleneck that can hinder almost every aspect of your growth and competitiveness. It’s evident that in recent years, traditional reporting methods have become inadequate for the demands of modern pharmacy businesses.
In this blog article, we will explore how the manual process of pharmacy data reporting can be improved and elevated using the right tools, specifically RWA Pharmacy’s interactive dashboards.
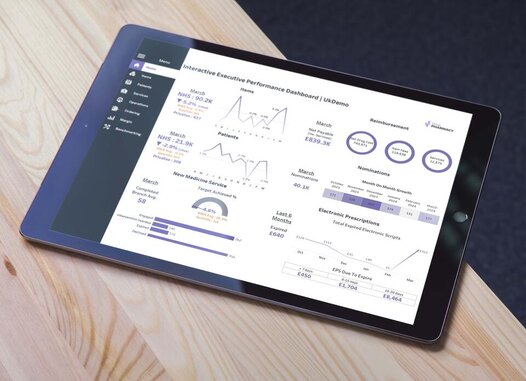
An interactive dashboard is a dynamic report that allows users to analyse complex pharmacy data in real-time. Presented in a visually appealing and user-friendly manner, this format serves as a powerful tool for pharmaceutical businesses that want to delve into the details of their branches without consuming excessive resources.
Unlike traditional static reports, which only provide a fixed snapshot of information and cannot present you with a comparative full picture of your business, interactive dashboards can be filtered to specific trends, patterns and anomalies within a matter of minutes. This particular tool has allowed RWA Pharmacy to enhance and innovate its product offerings, further improving its customer experiences by providing new insights into business performance.

RWA Pharmacy is dedicated to helping our clients make informed decisions with confidence. Our interactive dashboards enable clear and strategic decision-making, guiding our clients to success at every stage of their business development. To provide a clearer understanding of our interactive dashboards, we have compiled a list of benefits below. These will outline how every aspect of your pharmacy data reporting can be simplified when you implement our interactive dashboards.
1. Improved data efficiency
Say goodbye to manual reporting headaches - our interactive dashboards automate pharmacy data crunching, so you can spend less time analysing and more time acting. With just a few clicks, you'll get clear insights into your business performance, including year-on-year comparisons. It's like having a personal pharmacy data analyst at your fingertips, saving you countless hours and boosting your bottom line.
2. Enhanced data collaboration
Collaboration is key in pharmaceutical reporting, but relying on outdated data can lead to costly mistakes. Our interactive dashboards are designed to eliminate this risk by providing a single, centralised source of truth. By sharing one all-encompassing dashboard with your team, you can ensure that everyone is working from the same playbook, making informed decisions based on the most accurate insights.
3. Delve deeper into your data
Our interactive dashboards are more than just pharmacy data visualisation tools; they're powerful platforms that reveal the hidden stories within every single one of your pharmacy branches. By analysing data from each branch over time, you can easily identify trends, patterns, and anomalies that might otherwise go unnoticed. This deeper understanding empowers you to uncover hidden opportunities, pinpoint areas for improvement, and make data-driven decisions that ensure your pharmacy operations remain efficient and profitable across the board.
4. Frequent updates to your data
Our interactive dashboards regularly provide new insights into your pharmacy data, keeping you ahead of the curve. With this information, you can react swiftly to market fluctuations, adapt to changing trends, and capitalise on new opportunities. You can also predict future trends, forecast demand, and plan your strategy accordingly. Additionally, you can identify and retain customers by pinpointing new customers and proactively addressing potential churn with our overdue patient analysis.
5. Benchmarking your success
RWA Pharmacy partners with a diverse range of pharmaceutical businesses, giving us a deep understanding of industry best practices. As part of our interactive dashboard service, we offer benchmarking capabilities that allow you to compare your pharmacy's performance against top competitors. This valuable data can help you pinpoint areas for improvement, set ambitious goals, and ensure your pharmacy stays ahead of the curve in a competitive market.
6. User-friendly data management
Managing pharmacy data across multiple platforms can be a time-consuming and resource-intensive task. Our interactive dashboards streamline the process by providing a unified and user-friendly platform for all your data needs. With a simple interface and powerful features, you can easily access and visualise your pharmacy data in a way that makes sense to you.
7. We listen to your requests
While we maintain a standardised format for our interactive dashboard, our team will continue to collaborate closely with you to align your dashboard perfectly with specific KPIs and requirements. Have a development idea? Our experts will spend some time evaluating your suggestion. If it aligns with our vision, we'll implement it across our client base, ensuring everyone benefits from the latest advancements. With a rapid turnaround time, we can guarantee your dashboard will remain efficient and up-to-date, empowering your business growth and adaptability.

Want to transform your pharmacy data into actionable insights? Our interactive dashboards can help you streamline operations, improve efficiency, and drive growth with renewed confidence. Contact us today to schedule a demo, learn more about our Dispensary + Insights solution and discover how our business intelligence platform can make a real difference for your pharmacy.
To delve deeper into the importance of data visualisation, explore our blog post on the power of visual analytics.
Interested to learn more?
Interested to learn more?
Sign up and stay up to date
Interested to learn more about RWA Pharmacy, our solutions and innovations? Sign up to our email newsletter here!


